Export SAC Widgets into native Office charts
Normally, an export of an SAP Analytic Cloud dashboard will show all contents as images in the Office formats. This ensures that all dashboard elements are displayed 100% the same way in the Office document as they have been designed. Also, data cannot be changed in this case.
However, there are two downsides to this:
- Elements do not feel “integrated” into the document format
- Data and formats cannot be edited if desired
Therefore, biExport from the start has allowed SAC tables to be exported as editable tables in PowerPoint, Word, or Excel. Also text-based elements such as texts, text areas, dropdown boxes and filters have been supported, e.g. to show dashoard filters as an integral part of the document.
We now took this feature again one step further: biExport now translates the SAC chart definition into native Office charts! With this feature, an SAC chart is shown in Office as an exact copy, which is fully editable and customizable!
Now you can create PowerPoint and Word documents from SAC that have the perfect look and feel. Also exports of charts to Excel now make perfect sense!
Example exports
Here are some example exports with the new feature:
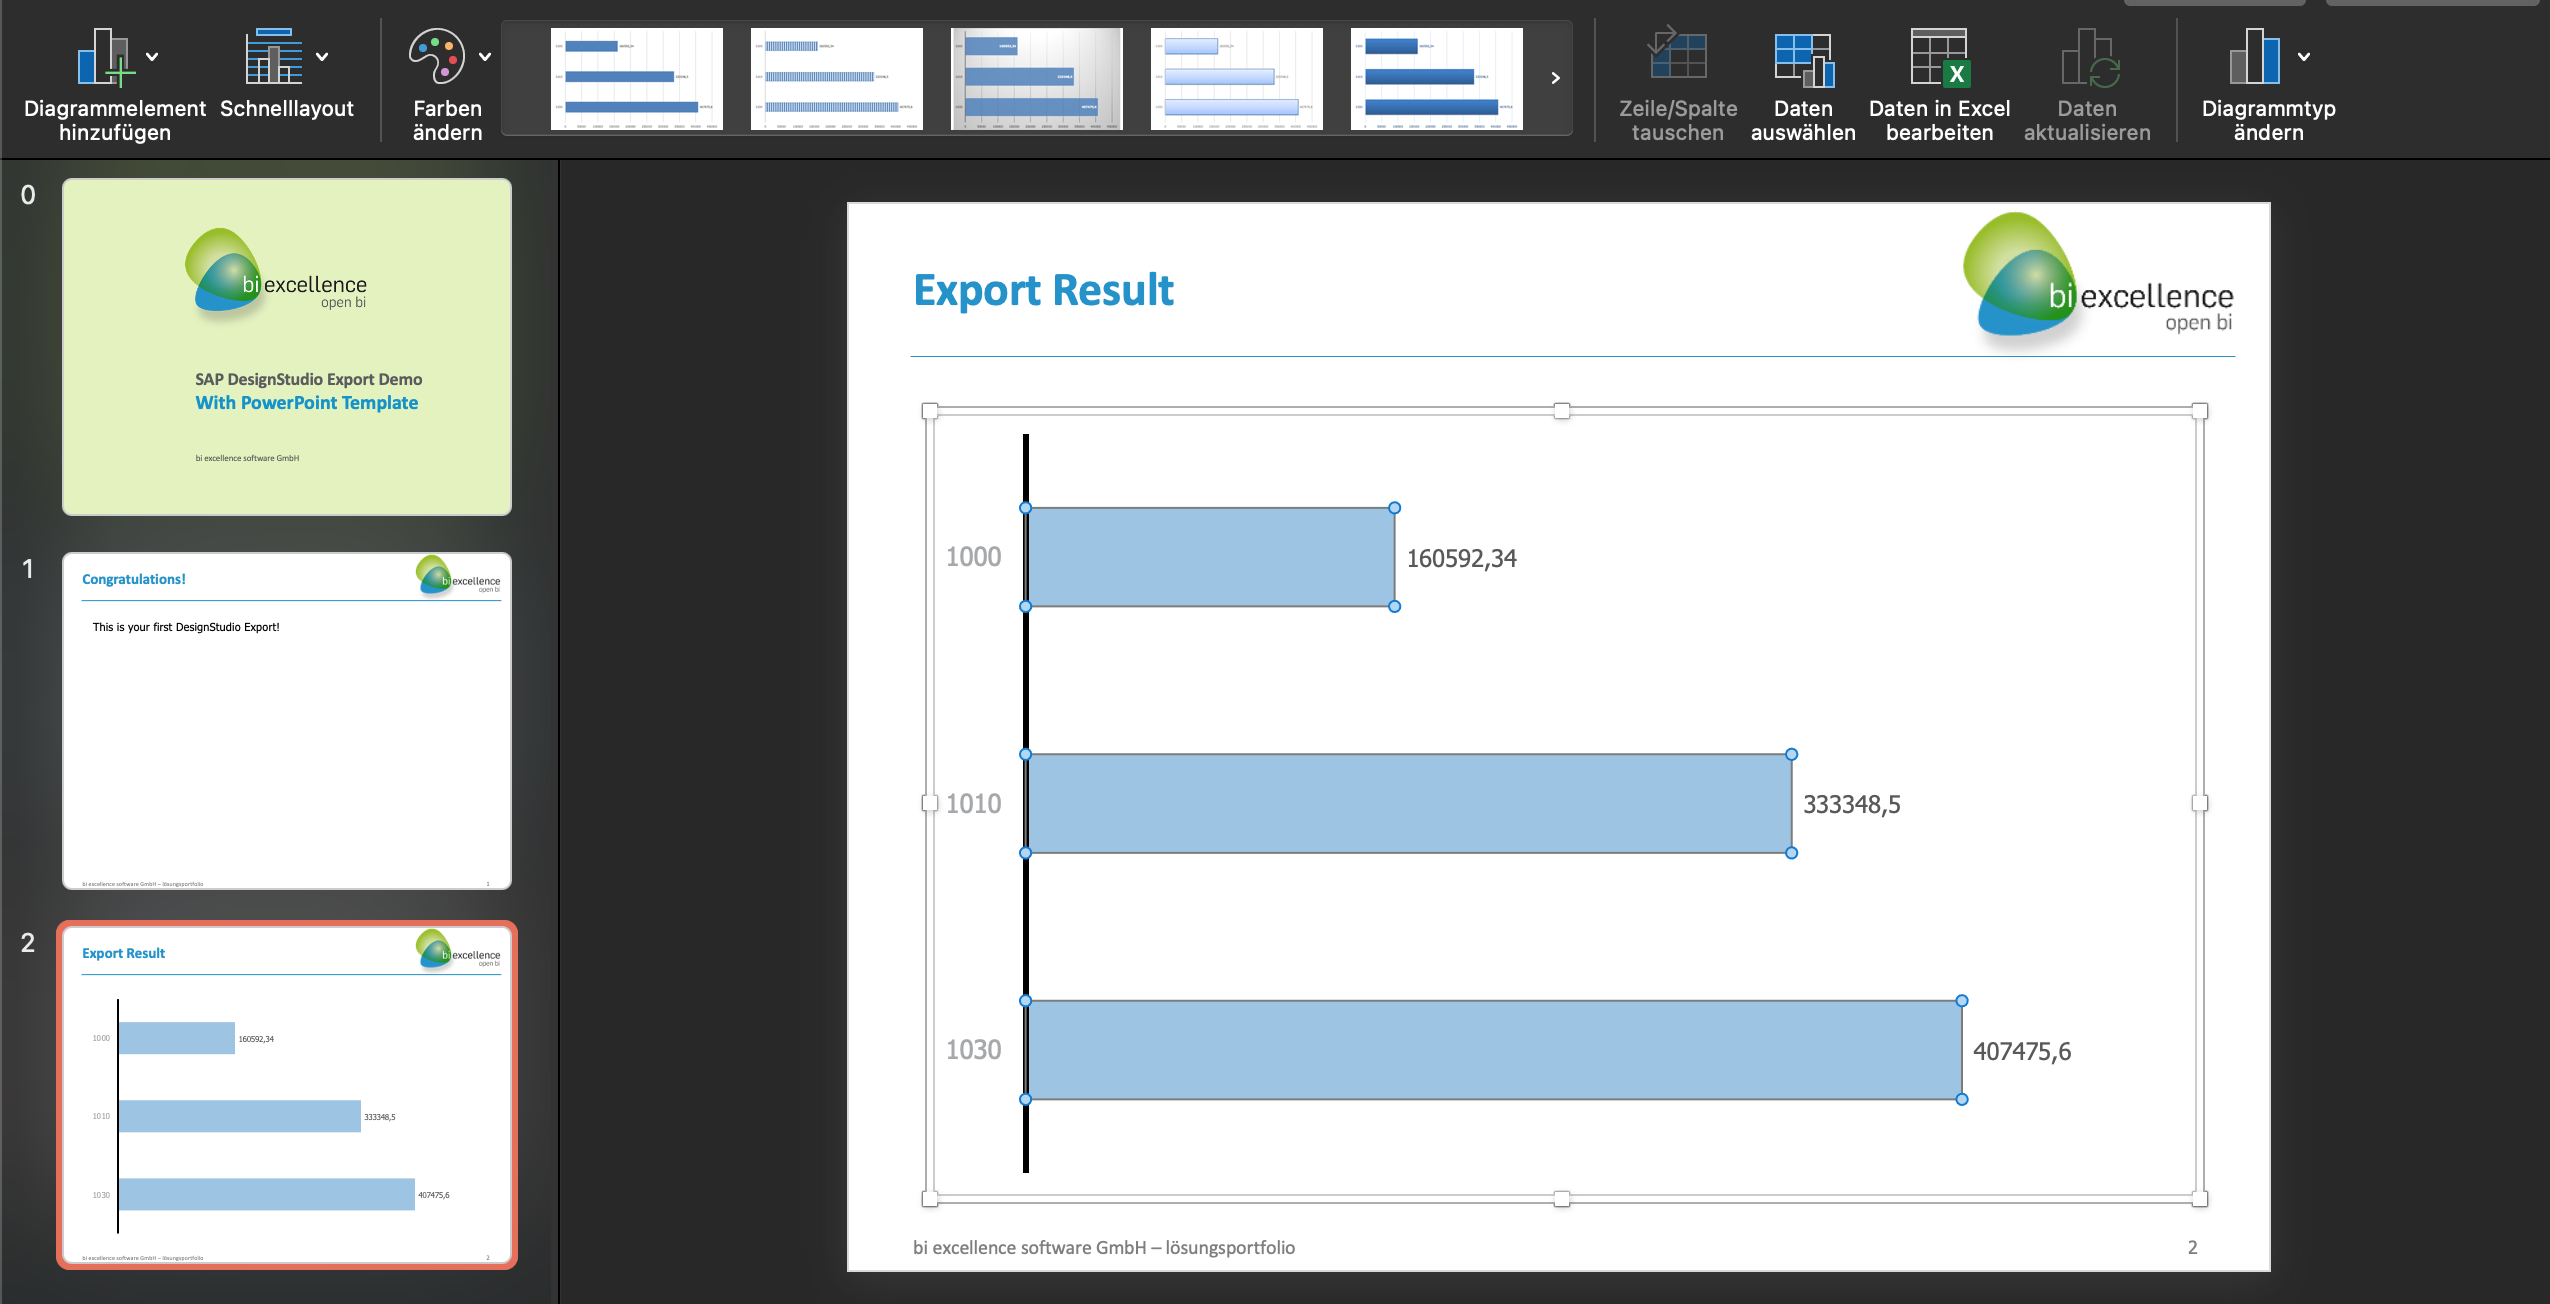
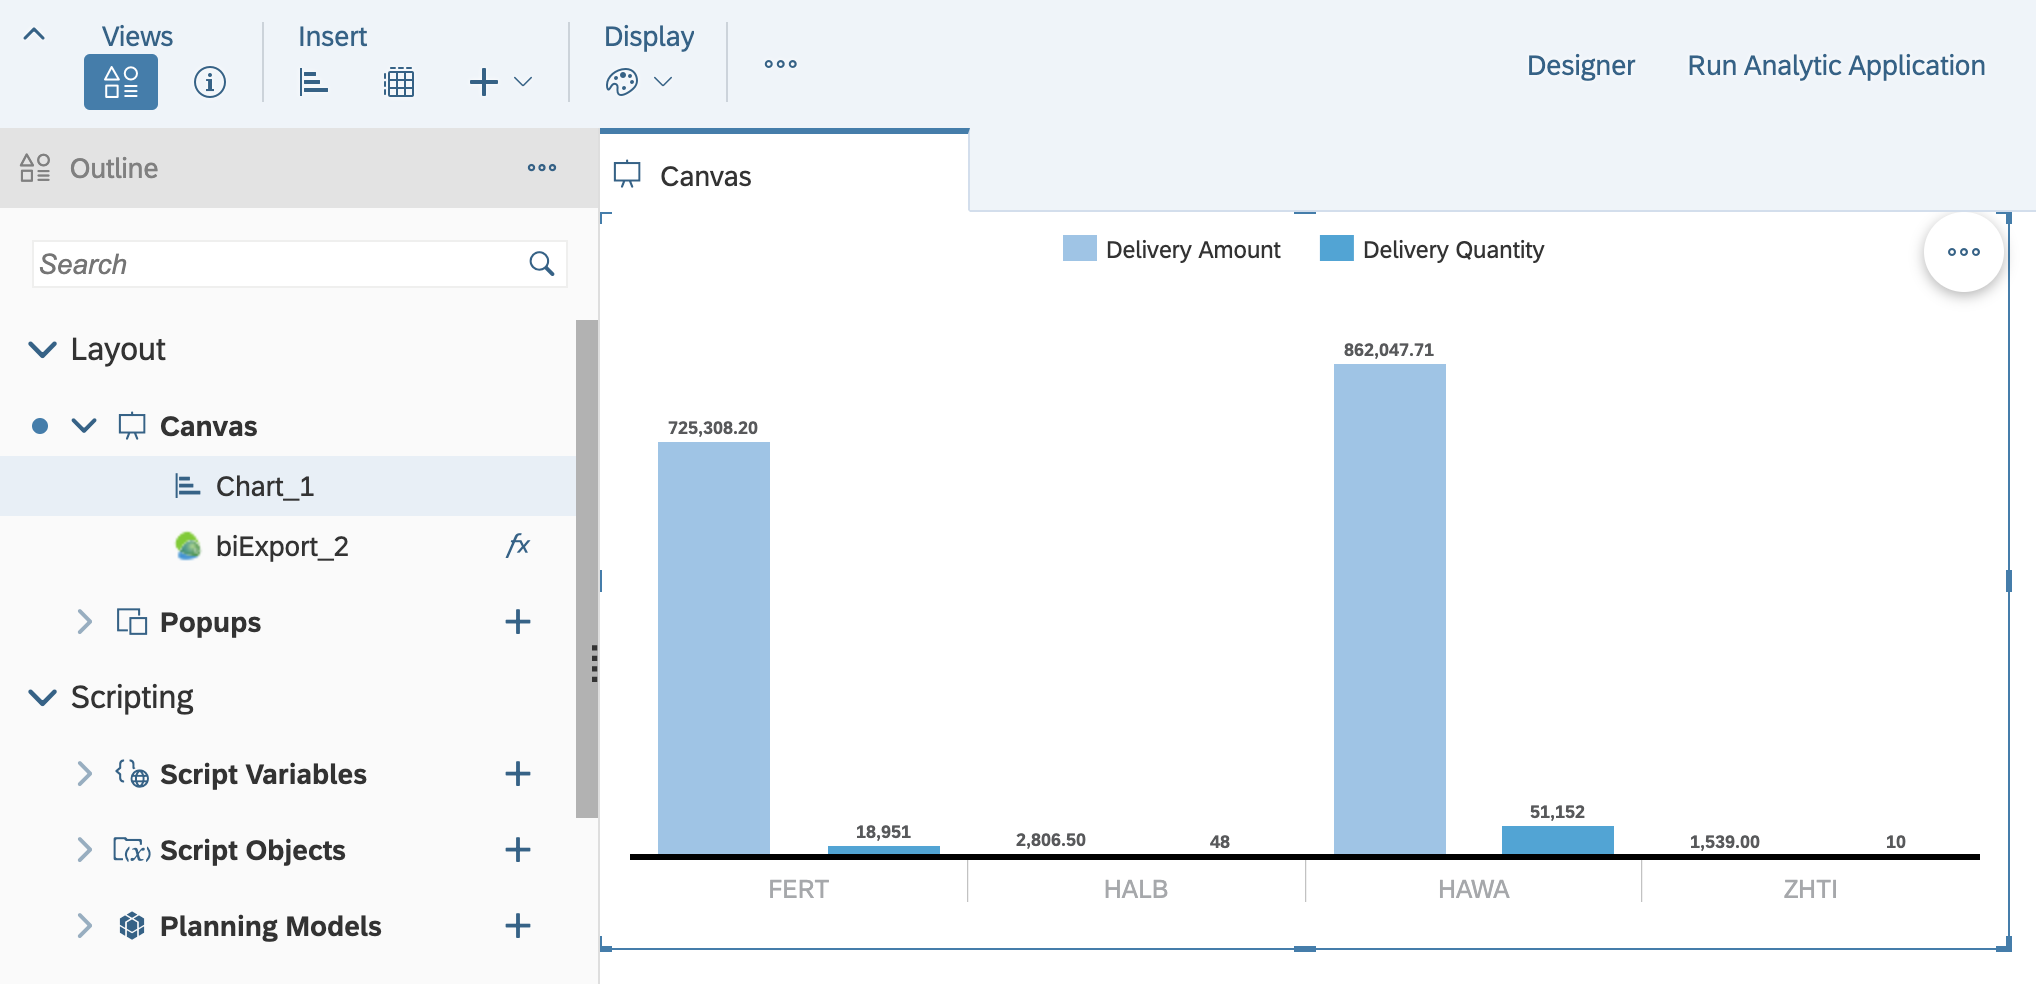
Export of a bar chart...
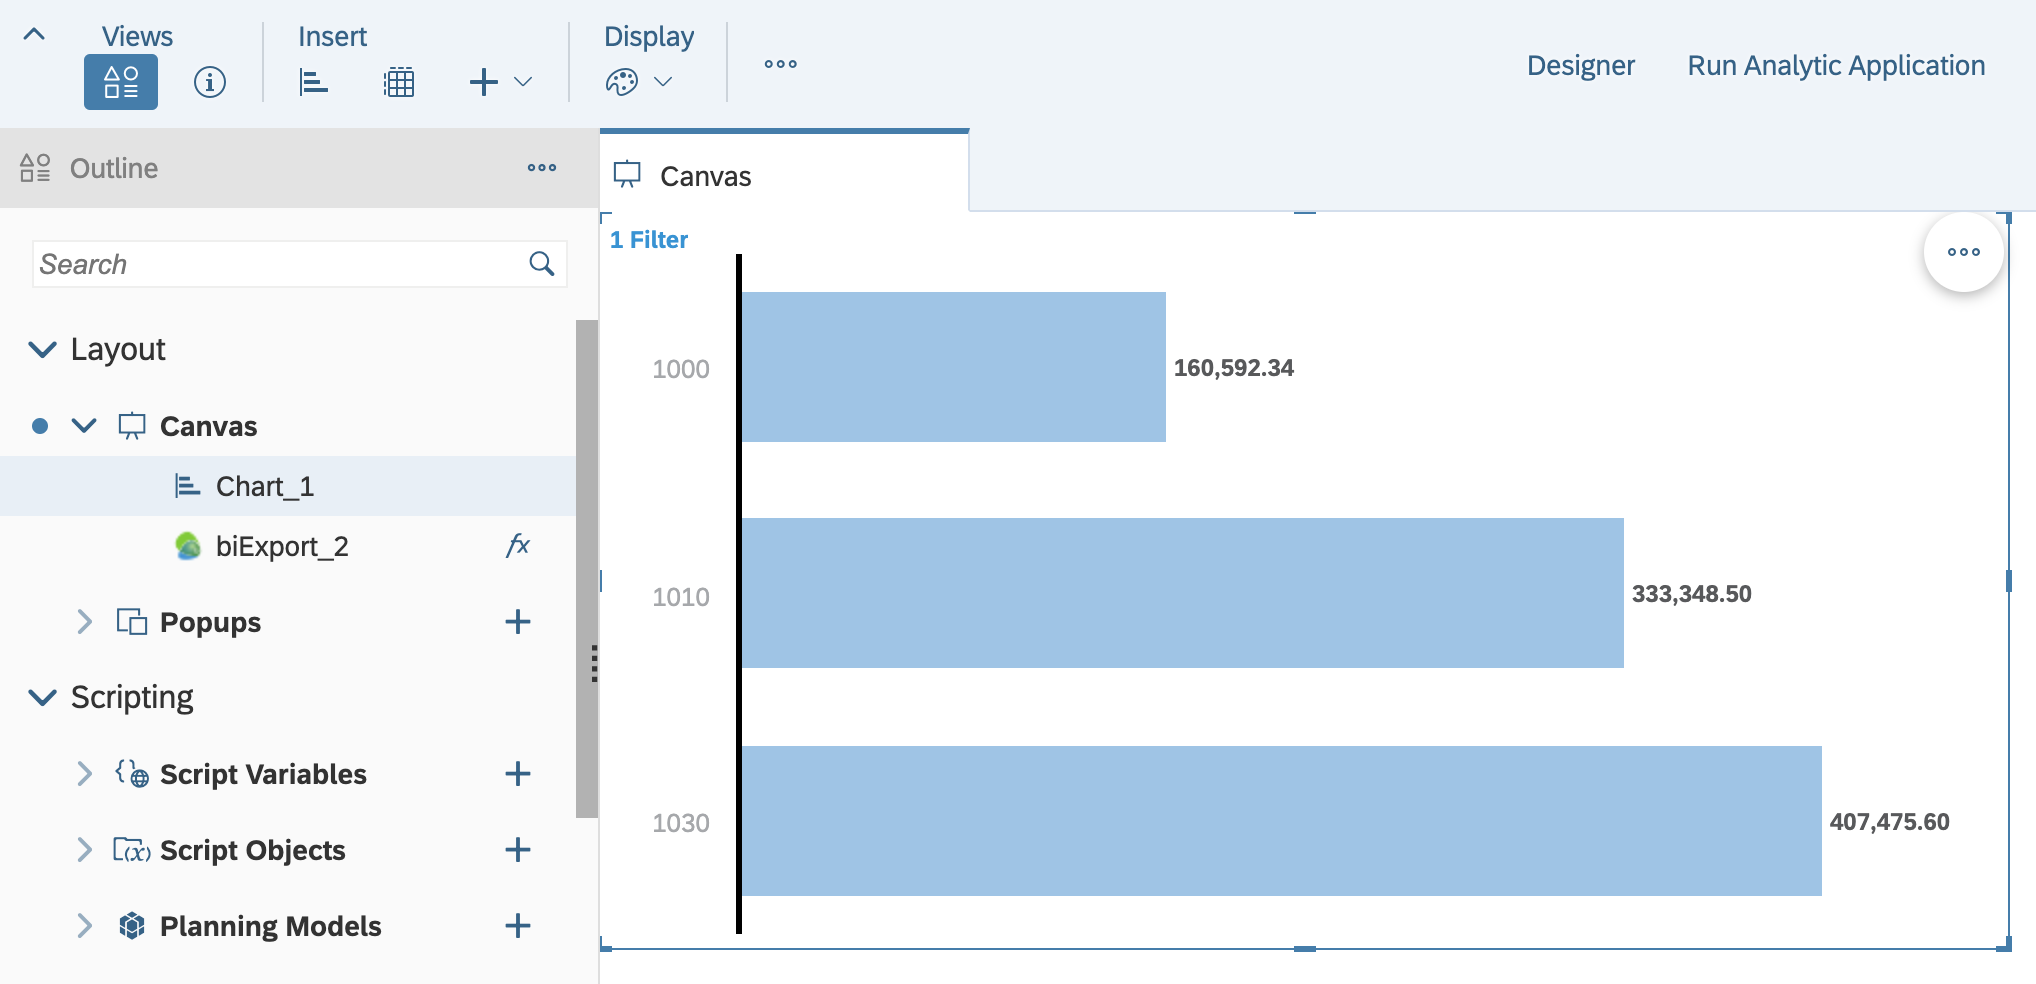
... to a native PowerPoint chart:
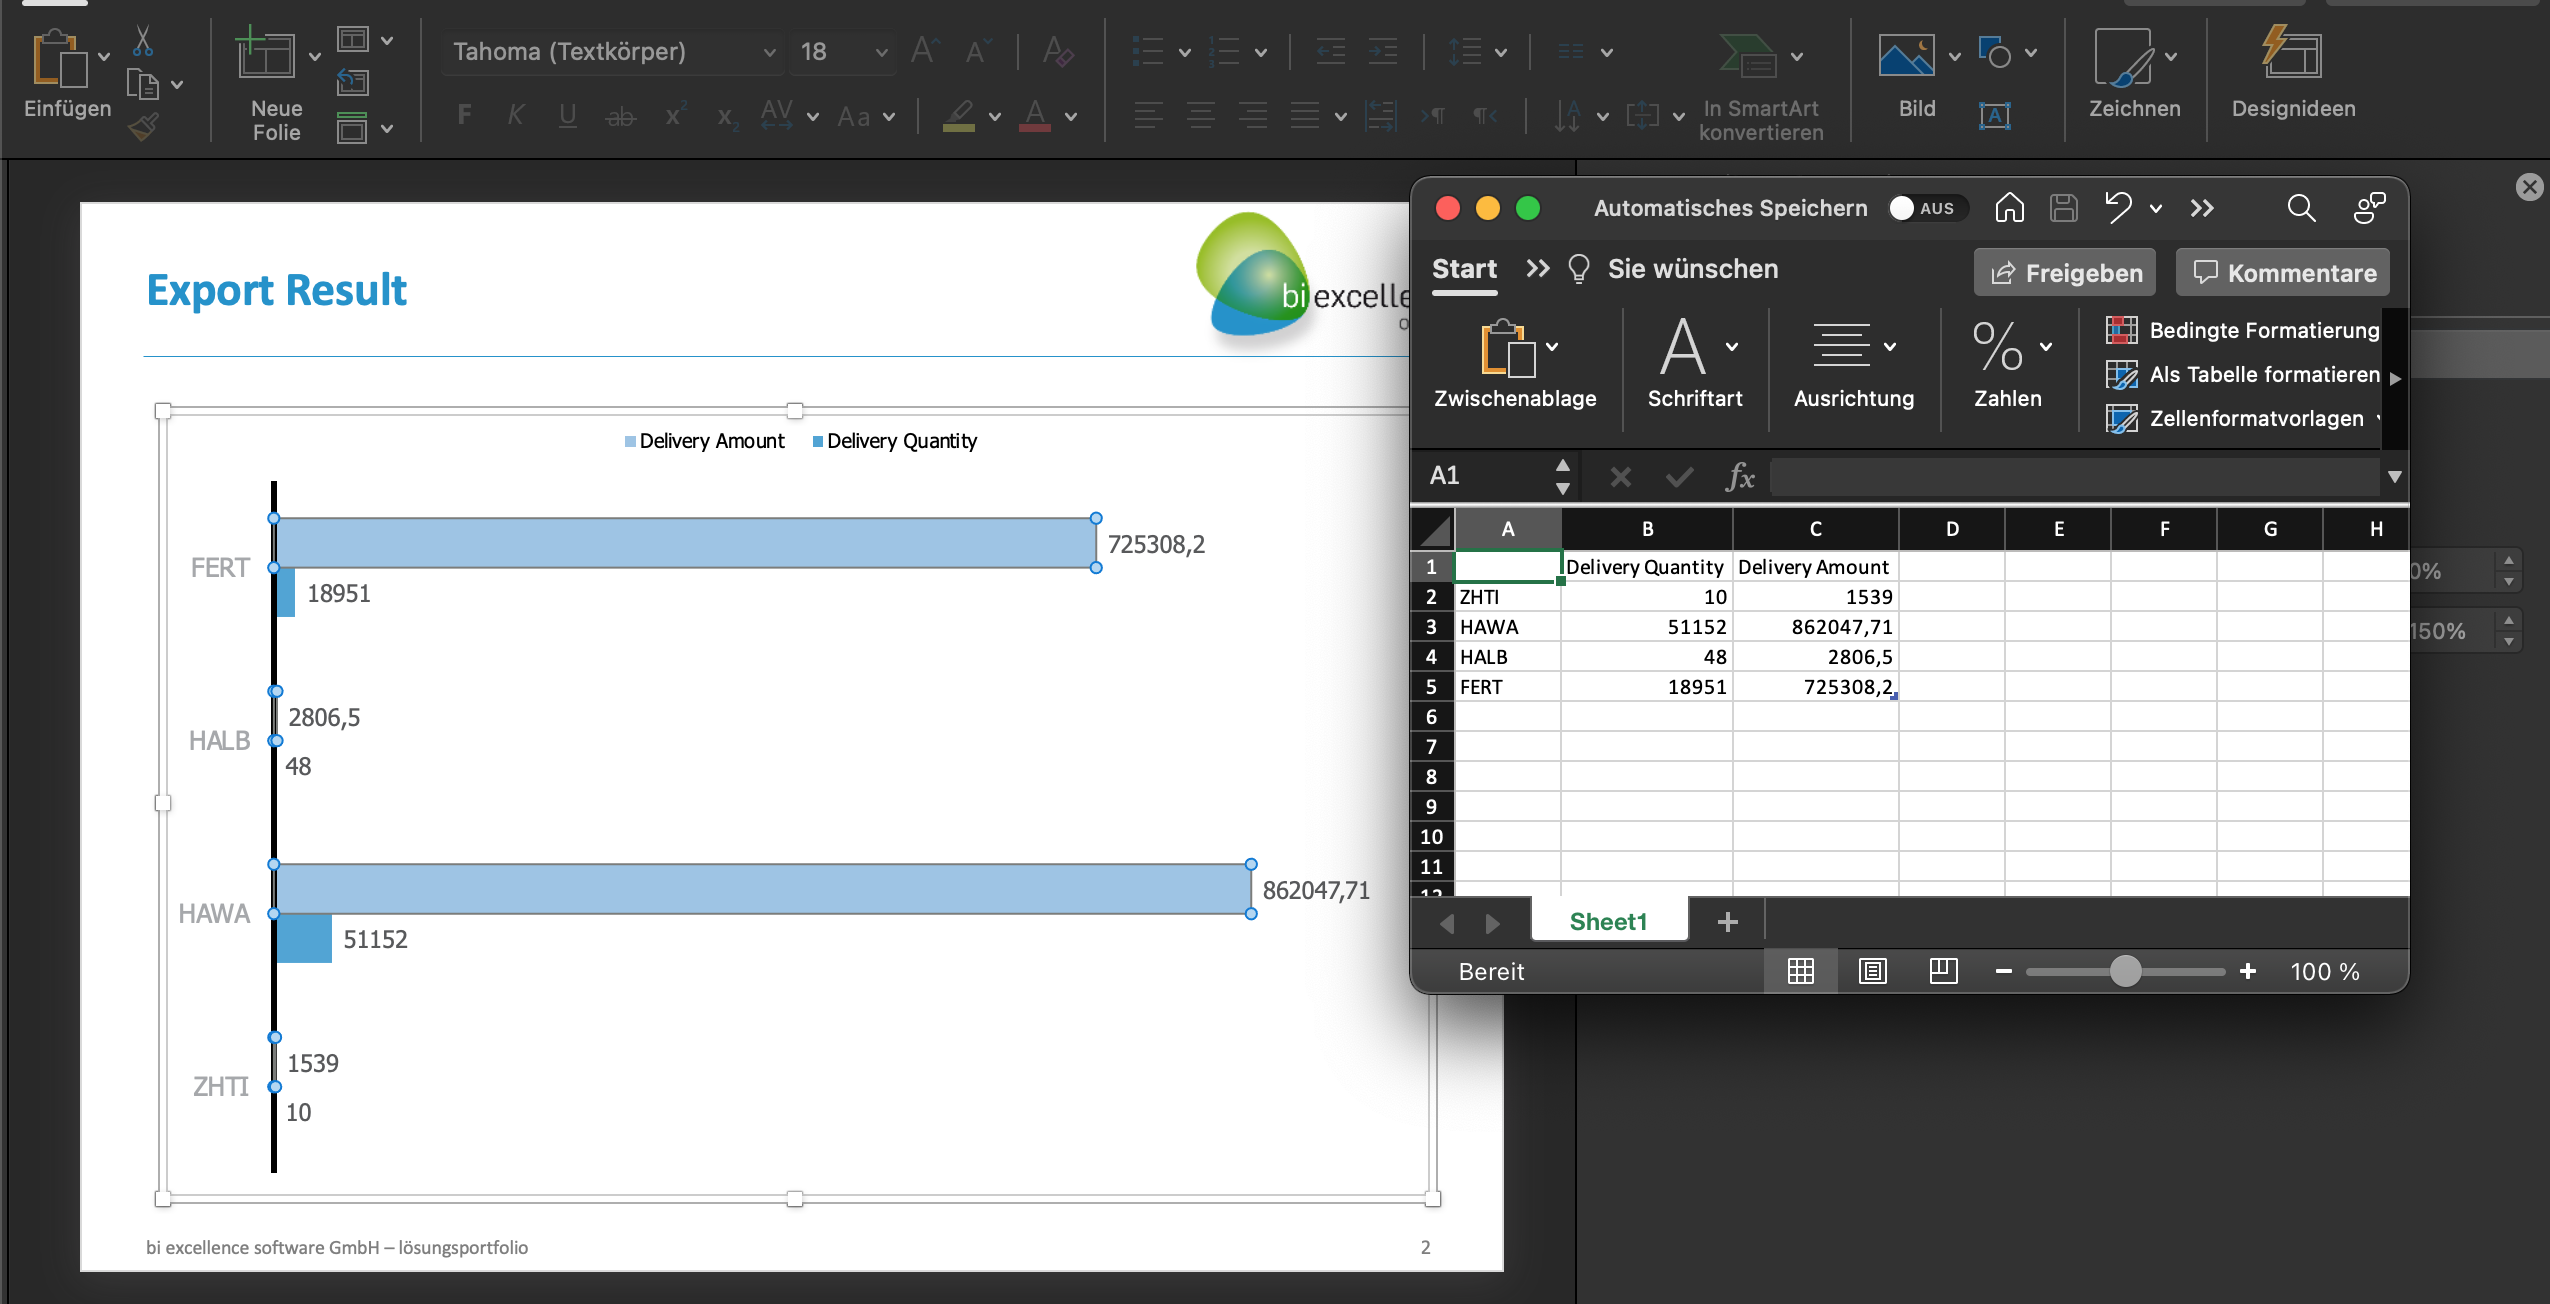
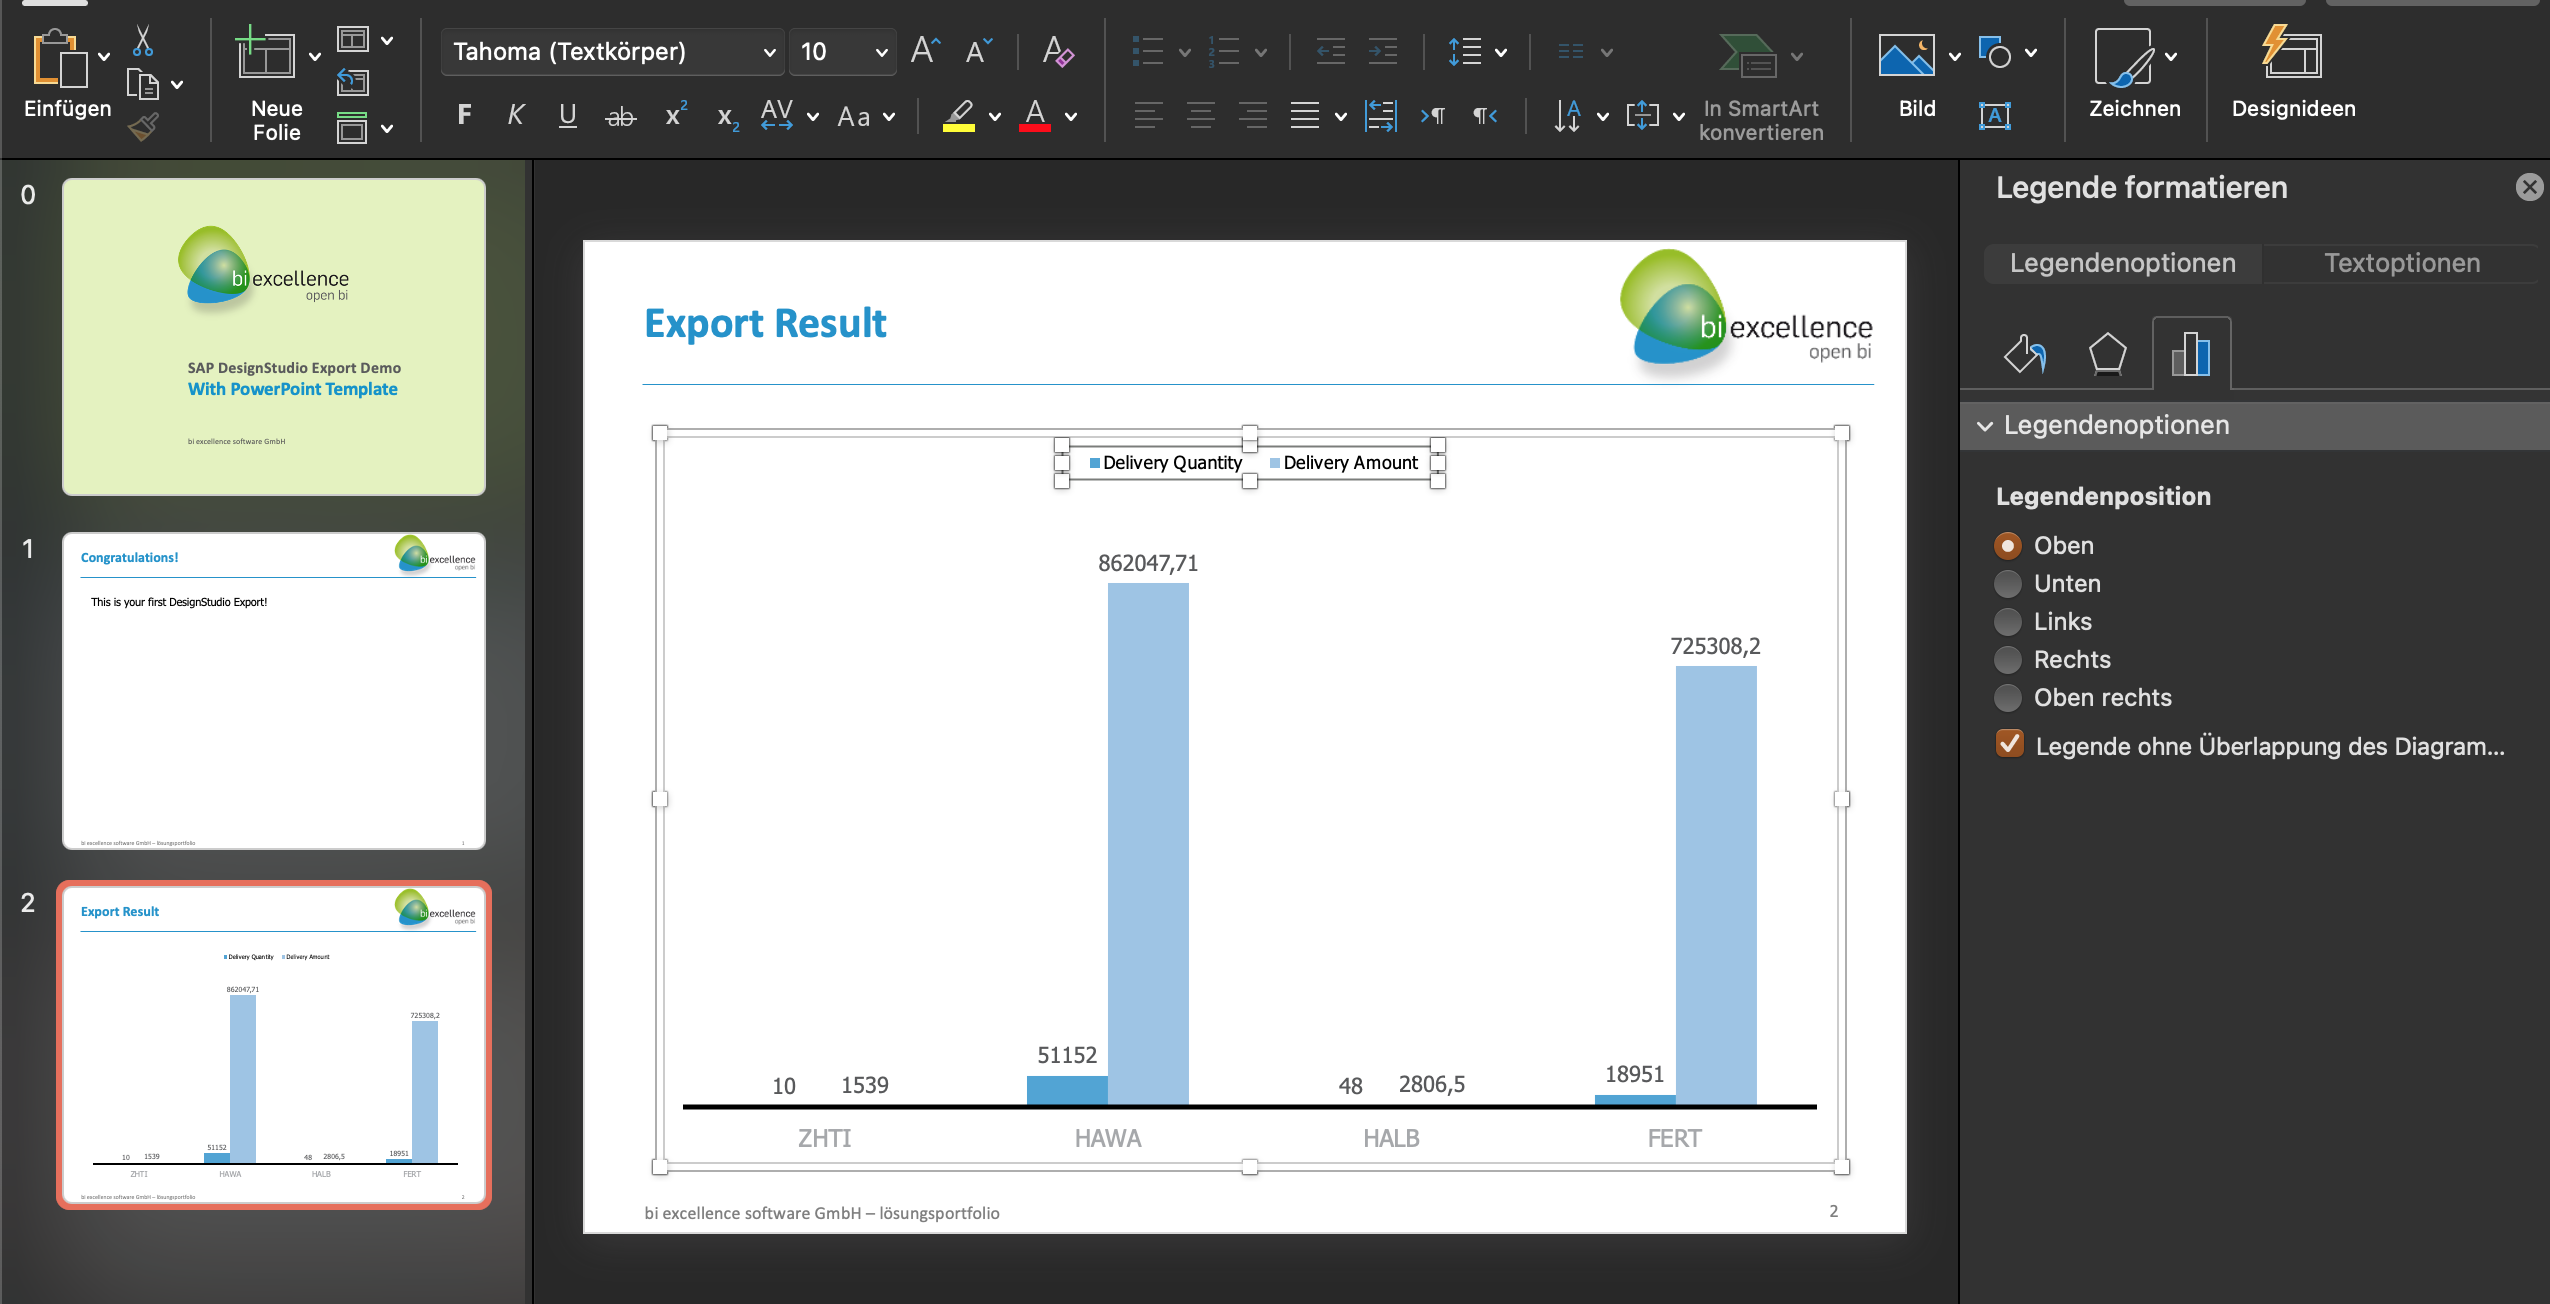
Now activating a second key figure...
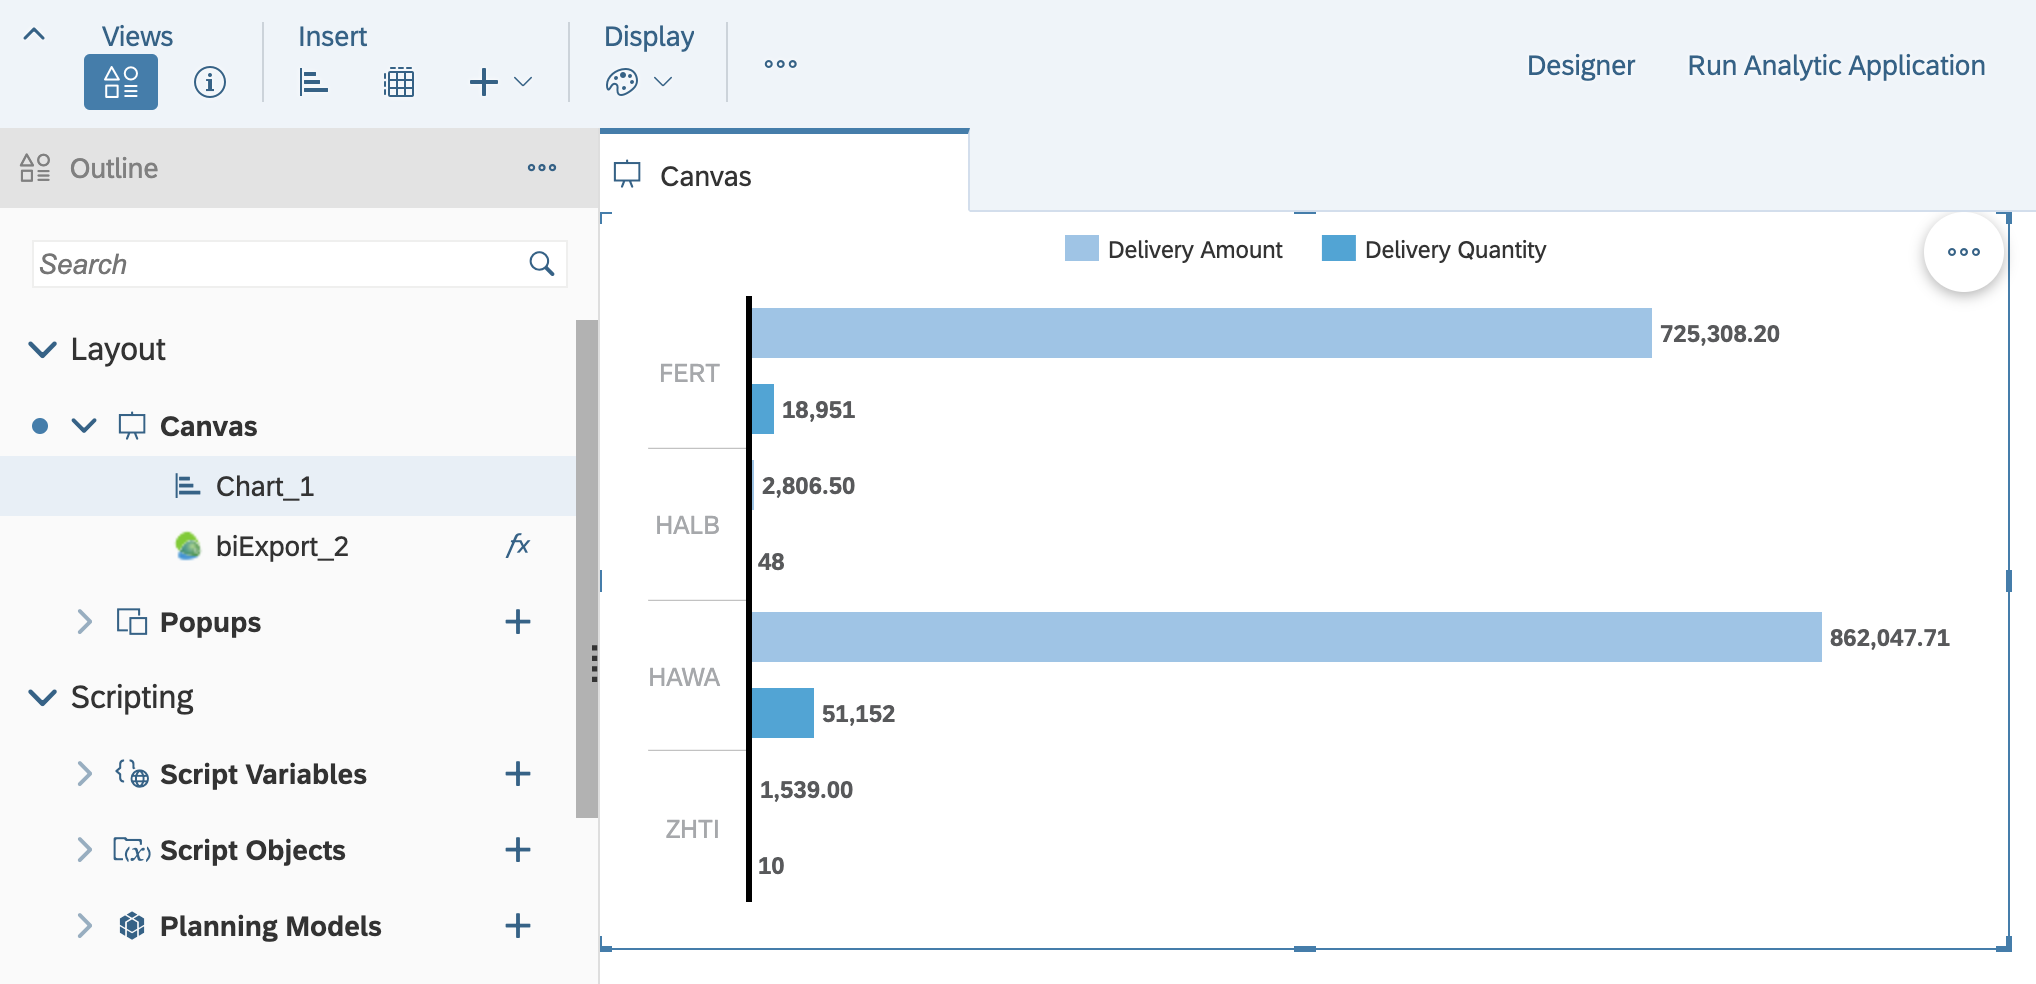
... and being able to edit the data afterwards:
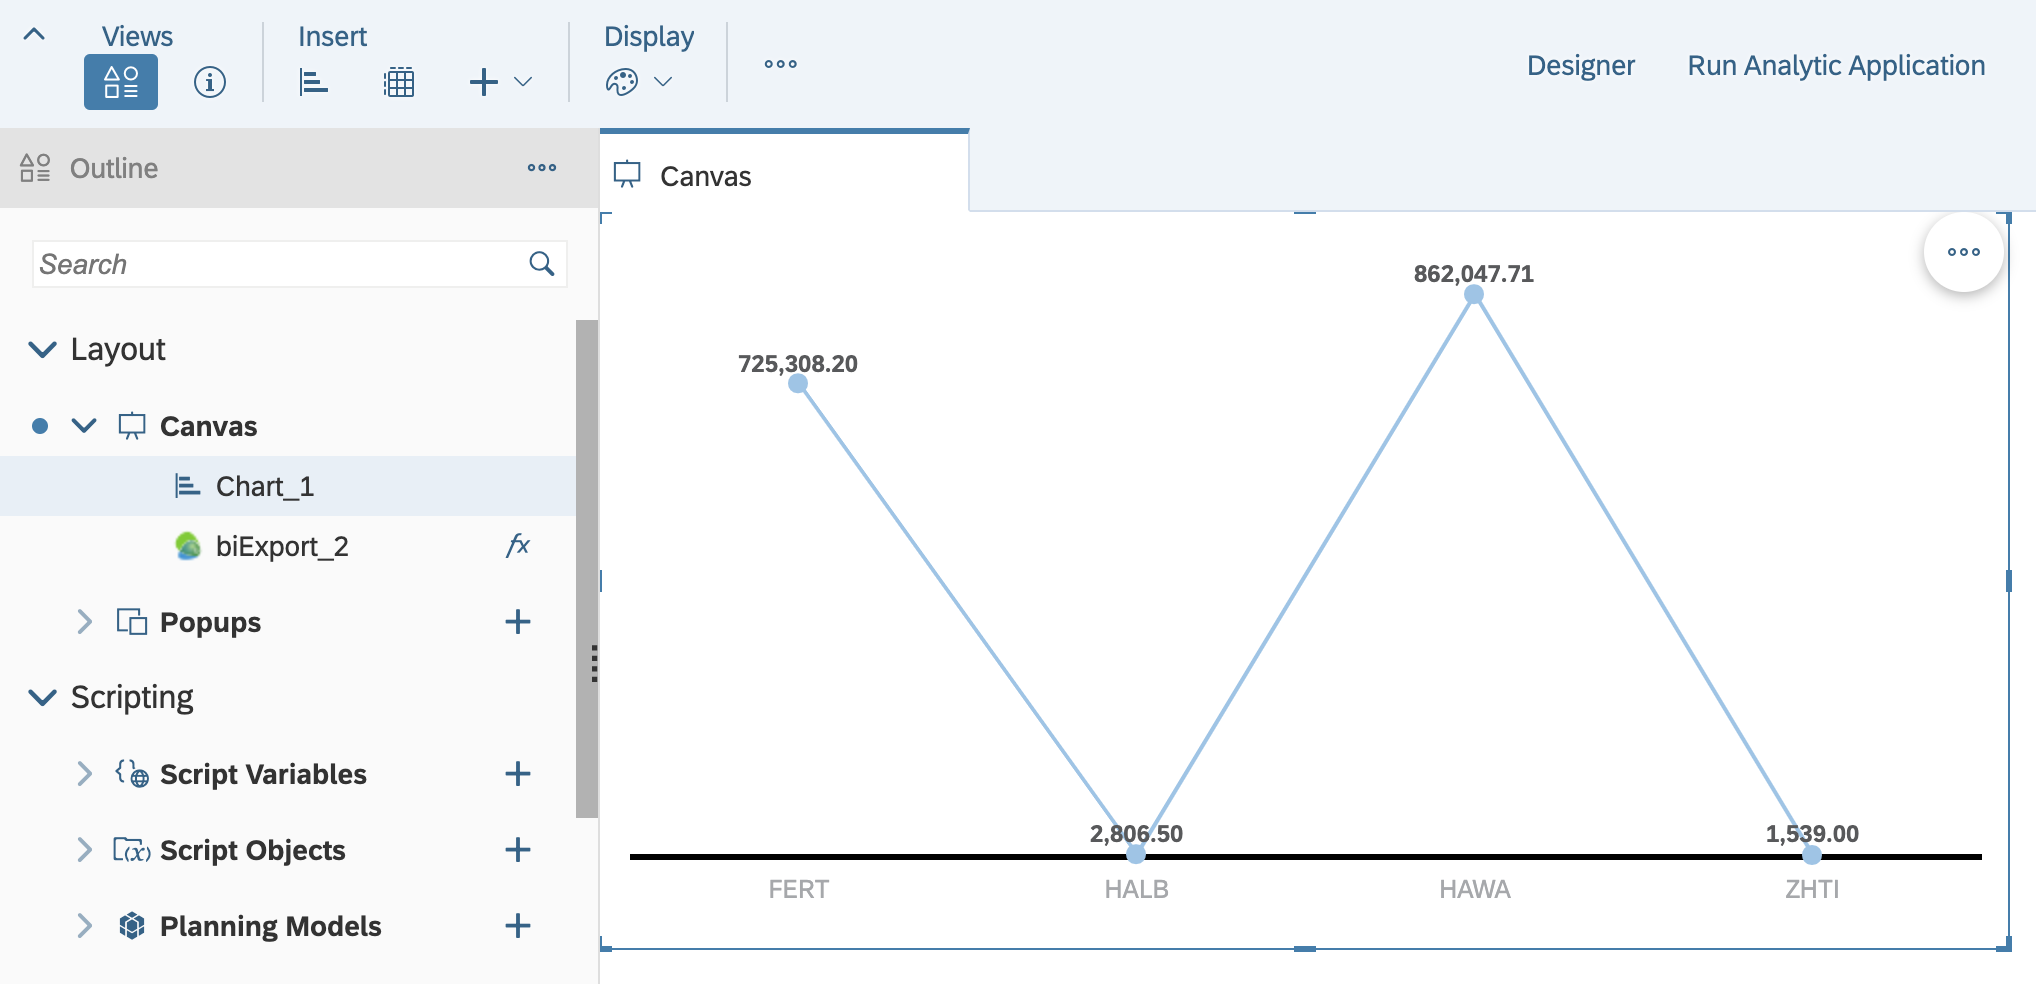
Switching orientation to a column chart...
... and all properties are transferred:
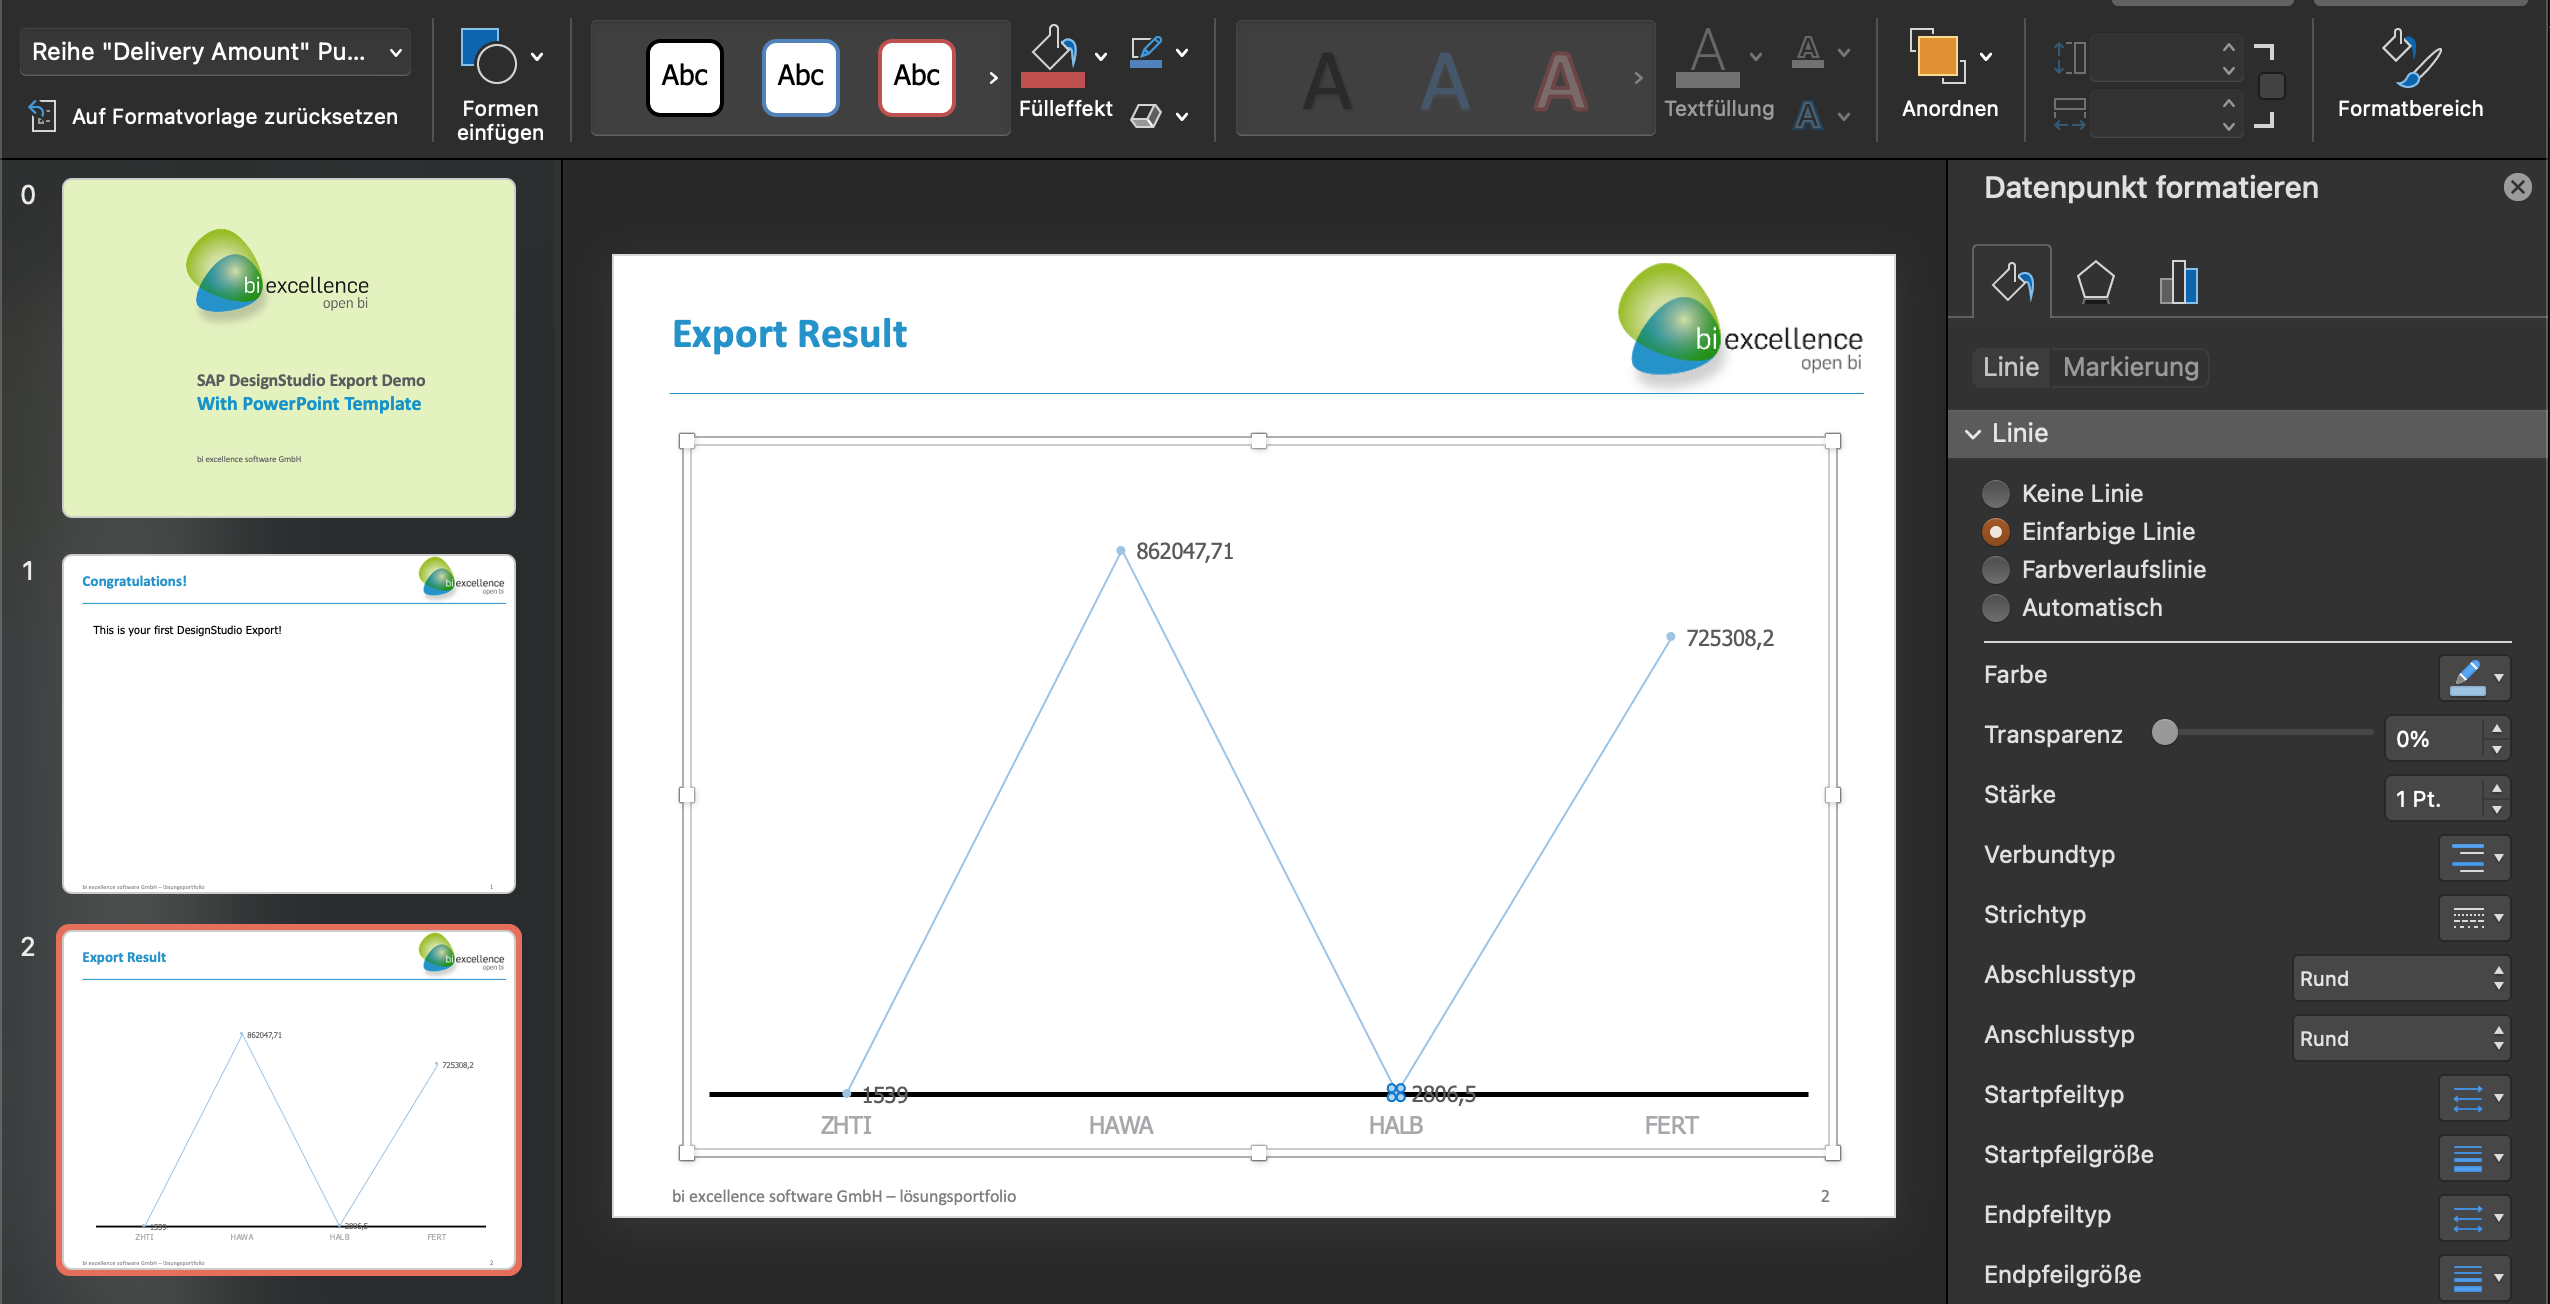
Finally switching to a line chart, eventhough this is absolutely the wrong choice for these data...
... biExport still exports correctly:
Setting it up
You have two simple ways of setting up the feature:
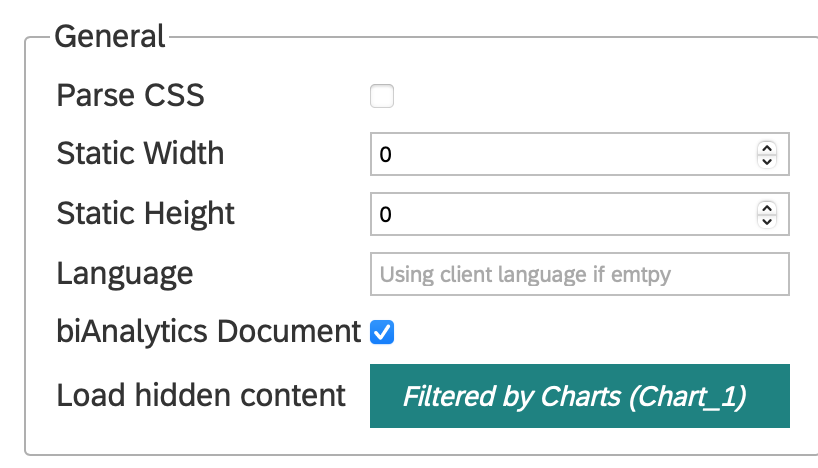
- If you use the %CONTENT% placeholder to export, simply activate the biAnalytics Document switch. In consequence all Widgets, which can be translated into native Office elements, will be displayed as editable elements in the export document.
- If you use explicit placeholders for the elements, such as %Chart_1% or %Table_1%:
- Adding the suffix :NATIVE to charts will render an Office chart:
%Chart_1%:NATIVE - Adding the suffix :TEXT to tables and other text-based Widgets will render the text of the Widget based on the formatting that has been specified for the Widget
- Adding the suffix :VALUE to tables and other text-based Widgets will render the text of the Widget based on the formatting of the placeholder.
In both cases, make sure that you select the chart that you want to export in the Load Hidden Content selector.
